Welcome to our comprehensive funnelytics review. In today’s digital age, having a solid funnel strategy is crucial for the success of any business. Funnelytics is a powerful tool that helps you easily map out and optimize your marketing funnels. In this review, we will explore its features, benefits, and how it can help you improve your marketing strategy. Whether you’re new to funnel building or an experienced marketer, you’ll find valuable insights in this article. Let’s dive in!
What Is Funnelytics?
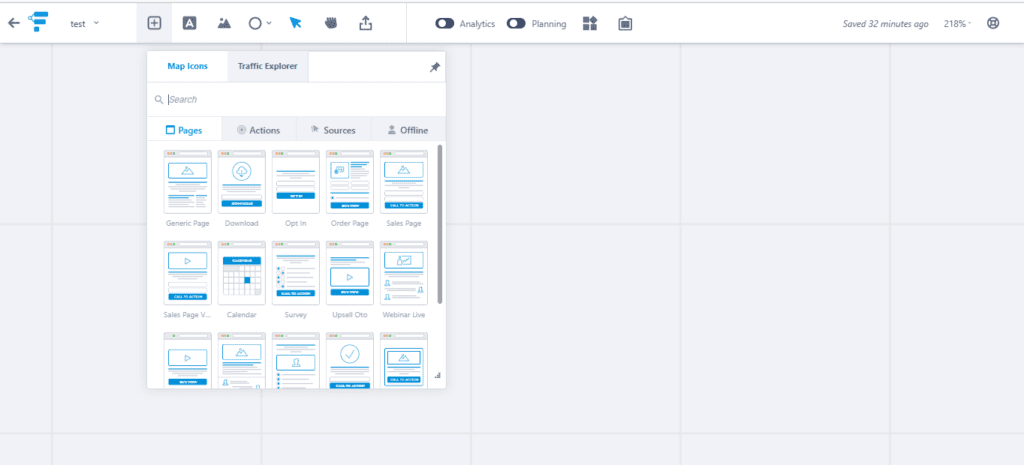
Funnelytics is a funnel mapping and analytics platform designed for digital marketers, entrepreneurs, and business owners. The platform allows users to create and visualize their sales and marketing funnels, track and analyze key metrics, and optimize their campaigns for better results. Funnelytics provides a visual drag-and-drop interface, making it easy for users to create and experiment with different funnel designs. It integrates with various marketing tools, such as Google Analytics and Zapier, to provide a comprehensive view of the user’s marketing performance.
Benefits Of Using The Funnelytics Software Tool
Using Funnelytics as your funnel mapping tool can bring many benefits, particularly if you are familiar with the software. The platform provides a blank canvas for you to use clearly and effectively to convey your ideas.
This clarity will also benefit your team members as they will be able to easily understand your funnel structure and grasp every aspect of your marketing plan without any confusion.
Additionally, Funnelytics allows for swift modifications to your finished product without negatively impacting its performance, making it an efficient and convenient tool to have.
Funnelytics Pricing Plans
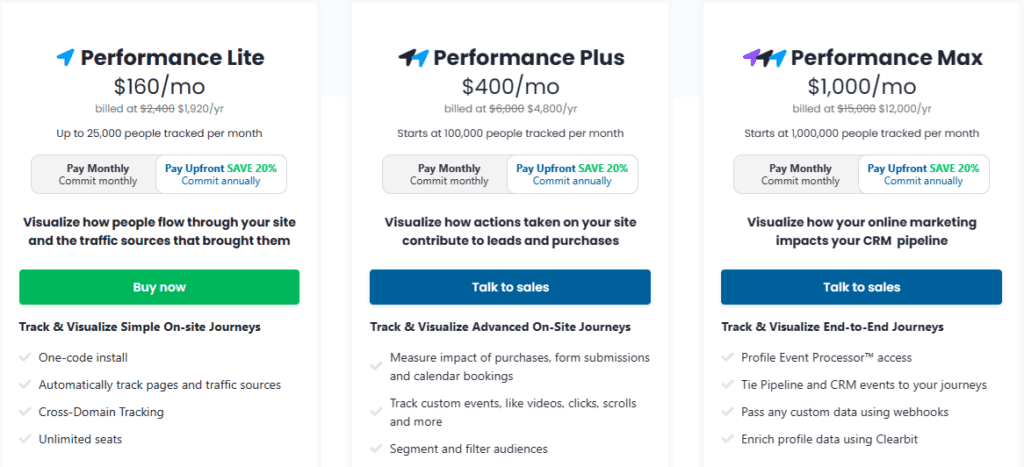
The plan includes a one-code installation and the ability to automatically track pages and traffic sources, as well as cross-domain tracking. It offers unlimited seats and access to on-demand training and education resources, including easy-to-follow product tutorials and a funnel template library. Additionally, you will have access to the Performance Masterclass and ticketed support.
The Performance Plus plan is priced at $400 per month and allows you to track and visualize advanced on-site journeys. The plan includes the ability to measure the impact of purchases, form submissions, and calendar bookings, as well as tracking custom events, such as videos, clicks, and scrolls. You can also segment and filter your audiences. The plan offers live training and education resources, including a 1-on-1 kick-off platform training session, access to a GTM Container Library, and Performance Optimization workshops. Additionally, you will have access to premium support.
The Performance Max plan is priced at $1,000 per month and provides the ability to track and visualize end-to-end journeys. The plan includes access to the Profile Event Processor™ and the ability to tie pipeline and CRM events to your journeys. You can also pass custom data using webhooks and enrich profile data using Clearbit. The plan provides the opportunity to work with the best in class, including the ability to work directly with Funnelytics’ team. Additionally, you will receive a 3-month dedicated setup and insights service and custom report building. The plan includes dedicated support.
Funnelytics Features
In this Funnelytics review, we established that it is a visualization and analysis tool designed for digital marketers and business owners. It helps in mapping out and analyzing the customer journey, identifying areas of improvement, and optimizing campaigns and funnels. Some of its key features include:
- Funnel mapping: Allows users to visualize their sales and marketing funnels, making it easier to understand where their customers are dropping off and what can be done to improve conversion rates.
- Analytics: Offers real-time insights into the performance of funnels and campaigns, allowing users to track key metrics such as clicks, conversions, and revenue.
- Heatmaps: Shows where customers are clicking on a page, providing valuable insights into which elements are driving engagement and where improvements can be made.
- A/B Testing: Allows users to test different variations of pages and funnels, enabling them to make informed decisions based on data-driven insights.
- Integration with popular tools: Funnelytics integrates with a wide range of tools such as Google Analytics, Facebook Ads, and others, making it easy to centralize all data and analyze it in one place.
- Collaboration: Enables teams to work together on funnel mapping, analysis, and optimization, making it easier for everyone to stay on the same page and work towards common goals.
- Funnel sharing and exporting: This makes it easy to share funnels and reports with stakeholders, as well as export data for further analysis and reporting.
- Customizable reports: Allows users to create custom reports that highlight the most important metrics and insights, making it easier to share results with stakeholders and make data-driven decisions.
Funnelytics Review
Funnelytics has been instrumental in allowing me to see my funnel from a bird’s-eye view and visualize each step in the journey. It has made it much easier for me to map out the experience for my readers and plan out my strategy without having to worry about making mistakes. I strongly believe that incorporating Funnelytics into your marketing toolkit can help you reach greater heights and accomplish goals that you once thought were unattainable, and that was my funnelytics review.
What is the best way to visualize funnels?
After our funnelytics review, I should mention that there are several ways to visualize funnels, and the best method depends on the type of data you’re working with, as well as the goals you’re trying to achieve. Here are a few popular methods:
- Stacked Bar Charts: This type of chart is often used to show how the proportions of different stages in a funnel change over time.
- Stacked Area Charts: Similar to stacked bar charts, stacked area charts are used to show how the proportions of different stages in a funnel change over time. However, stacked area charts emphasize the total size of the funnel over time.
- Step Funnel Charts: This type of chart represents the different stages in a process and the flow of visitors from one stage to the next. The width of each step represents the number of visitors at that stage, and the height represents the conversion rate.
- Pie Charts: Pie charts can be used to show the distribution of visitors across different stages in a funnel. Each slice of the pie represents a stage, and the size of the slice represents the number of visitors at that stage.
- Sankey Diagrams: Sankey diagrams are used to represent the flow of visitors between different stages in a funnel. The width of each flow represents the number of visitors, and the direction of the flow represents the progression through the stages of the funnel.
The best way to visualize a funnel will depend on the type of data you have and the story you want to tell. I would suggest experimenting with different types of charts and finding the one that best suits your needs.
What is funnel tracking?
Funnel tracking is a process of measuring and analyzing the steps or stages a user takes toward a desired goal or conversion on a website or application.
Helps businesses track website/app navigation and identify conversion barriers.
A typical funnel includes several stages, such as visiting the site, adding items to the shopping cart, filling out a form, and making a purchase.
Funnel tracking involves monitoring the number of visitors who start at the first stage and then tracking how many of those visitors progress to each subsequent stage until the desired conversion is achieved.
By tracking the performance of each stage in the funnel, businesses can identify areas for improvement, such as making changes to the website design, adding or modifying calls to action, or adjusting the checkout process. Funnel tracking aims to optimize the user experience and increase conversions.
Funnel tracking is typically done using analytics tools, such as Google Analytics, Adobe Analytics, or Mixpanel, or the tool we mentioned in this funnelytics review, which allows businesses to track user behavior and conversion rates across various stages in the funnel.
How do you do a funnel analysis?
Funnel analysis is a process of evaluating the performance of a sales or marketing funnel’s performance, aiming to optimize the user experience and increase conversions. Here are the steps to perform a funnel analysis:
- Define the stages: Identify the key stages in your funnel, such as visiting the site, adding items to the cart, filling out a form, and making a purchase. Make sure you define clear and measurable goals for each stage.
- Collect data: Use analytics tools, such as Google Analytics, to track user behavior and conversion rates across each stage in the funnel. Collect data over a sufficient period of time to get a clear understanding of the performance of your funnel.
- Visualize the data: Create charts and graphs to visualize the data, such as stacked bar charts, stacked area charts, or Sankey diagrams, to see how the number of visitors progresses through each stage of the funnel.
- Analyze the data: Look for patterns and trends in the data, and identify any bottlenecks or roadblocks in the funnel that may be preventing conversions. Compare the performance of each stage over time to see if there have been any improvements or deteriorations.
- Identify areas for improvement: Based on your analysis, identify areas where you can improve the user experience and increase conversions. For example, you may need to optimize the checkout process, modify calls-to-action, or redesign the website.
- Test and iterate: Implement the changes you’ve identified, and continue to monitor and analyze the data to see if they have had the desired impact.
Funnel analysis is an ongoing process, and it’s important to continually monitor and analyze the data to identify areas for improvement and optimize the performance of your funnel. This is why I thought I mentioned it in funnelytics review.
FAQ
Funnel tracking is a marketing technique that involves tracking and analyzing a customer’s journey from their initial interaction with a brand to the final conversion or purchase. The customer’s journey is often referred to as a “funnel,” as it represents the different stages a customer goes through, with each stage narrowing down the pool of potential customers until they reach the end goal of making a purchase or taking a specific action.
Yes, you can make money with funnels. Funnels are often used as a sales and marketing tool to drive potential customers through a series of steps that lead them to take a specific action.
Whether funnels are better than websites is subjective and depends on a business’s specific needs and goals.
No, Funnelytics streamlines funnel creation and tracking with stats calculation.
The first and most significant reason you would want to use a funnel sketching tool for your business is to help you organize your marketing tactics.
